InstaForex

Wednesday, November 16, 2011

The 15 Rules of Bollinger Bands


The 15 Rules of Bollinger Bands

  1. Bollinger Bands provide a relative definition of high and low.
  2. That relative definition can be used to compare price action and indicator to arrive at rigorous buy and sell decisions.
  3. Appropriate indicators can be derived from momentum, volume, sentiment, open interest, inter-market data, etc.
  4. Volatility and trend have already been deployed in the construction of Bollinger Bands, so their use for confirmation of price action is not recommended.
  5. The indicators used for confirmation should not be directly related to one another. Two indicators from the same category do not increase confirmation. Avoid colinearity.
  6. ollinger Bands can also be used to clarify pure price patterns such as M-type; tops and W-type bottoms, momentum shifts, etc.
  7. rice can, and does, walk up the upper Bollinger Band and down the lower Bollinger Band.
  8. Closes outside the Bollinger Bands can be continuation signals, not reversal signals--as is demonstrated by the use of Bollinger Bands in some very successful volatility-breakout systems.
  9. The default parameters of 20 periods for the moving average and standard deviation calculations, and two standard deviations for the bandwidth are just that, defaults. The actual parameters needed for any given market/task may be different.
  10. The average deployed should not be the best one for crossovers. Rather, it should be descriptive of the intermediate-term trend.
  11. If the average is lengthened the number of standard deviations needs to be increased simultaneously; from 2 at 20 periods, to 2.1 at 50 periods. Likewise, if the average is shortened the number of standard deviations should be reduced; from 2 at 20 periods, to 1.9 at 10 periods.
  12. Bollinger Bands are based upon a simple moving average. This is because a simple moving average is used in the standard deviation calculation and we wish to be logically consistent.
  13. Be careful about making statistical assumptions based on the use of the Standard deviation calculation in the construction of the bands. The sample size in most deployments of Bollinger Bands is too small for statistical significance and the distributions involved are rarely normal.
  14. Indicators can be normalized with %b, eliminating fixed thresholds in the process.
  15. Finally, tags of the bands are just that, tags not signals. A tag of the Upper Bollinger Band is NOT in-and-of-itself a sell signal. A tag of the lower Bollinger Band is NOT in-and-of-itself a buy signal.

Saturday, November 12, 2011

How to open an order in MT4?


How to open an account in instaforex?


SEE THIS PICTUE AND VIDEO
Write affiliate code properly for getting free tutorial from us. (Affiliate code:  CCEY)


How to trade with Bollinger Bands M W patterns


Bollinger band Condition for M W patterns: 

How to trade with Bollinger Bands


Bollinger Bands Condition for Sell order:

Bullish Three Outside Up


Bullish Three Outside Up

Definition :
The Bullish Three Outside Up Pattern is simply another name for the Confirmed ‘Bullish Engulfing Pattern’.The Third day is confirmation of the bullish trend reversal.

Recognition Criteria:
   After an established downtrend, day-one continues the trend with a red candle
   Day-two is a long blue day that engulfs the body of the first day, closing well above the previous days open.
   The third day is a blue day with an even higher close than the second day.
Important Factors:
The Bullish Three Outside Up pattern is one of the more clear-cut three day bullish reversal patterns. The formation reflects buyers overtaking selling strength, and often precedes a continued rally in price. In fact up to day-two we have a bullish Engulfing Pattern, itself a strong two-day reversal pattern.

Thursday, November 10, 2011

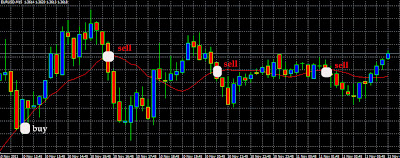
Moving average indicator signal


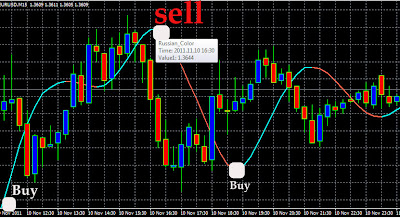
HMA Russian color indicator signal


Parabolic SAR indicator: Buy & Sell signal


Bullish Three Inside Up


Bullish Three Inside Up

Definition :
The Bullish Three Inside Up Pattern is another name for the Confirmed ‘Bullish Harami Pattern’.The Third day is confirmation of the bullish trend reversal.

Recognition Criteria:
  After an established downtrend, day-one is long red day
  Day-two is a blue day that trades up to the midpoint of day-one
  The third day is a blue day carrying price above the first bearish candle.
Important Factors:
The reliability of this pattern is very high, but still a confirmation in the form of a white candlestick with a higher close or a gap-up is suggested.

BULLISH RISING THREE METHODS


BULLISH RISING THREE METHODS

Definition: The Rising Three Methods bullish continuation pattern occurs in a bull market, where during an uptrend the market rests before resuming the trend. The bullish trends break is reflected by small candles that all stick to a strict market range formed by the aggressive move on day one.

Recognition Criteria:
  1. In an uptrend, the first day is long blue candle
  2. The next three days are short red candles, ideally not exceeding the range of day-one
  3.  The fifth day resumes the trend with a long blue candle

Important Factor:

  Number of Middle Candles
In a picture perfect formation the middle candles number three. But realistically the pattern may have two, four or even five candles. Individually each middle candle may be a star or Doji, red or blue.

BULLISH MORNING STAR


BULLISH MORNING STAR

Definition :
This is a three-candlestick formation that signals a major bottom. It is composed of a first long red body, ‘a second small real body, white or black’, gapping lower to form a star. These two candlesticks define a basic star pattern. The third is a blue candlestick that closes well into the first session’s red real body. Third candlestick shows that the market turned bullish now.

Recognition Criteria:
1. Market is characterized by Downtrend.
2. We see a long red candlestick in the first day.
3. Then we see a small body on the second day with a gap in the direction of the previous trend.
4. Finally we see a blue candlestick on the third day.

Important Factors:
The stars may be more than one, two or even three. The reliability of this pattern is very high, but still a confirmation in the form of a white candlestick with a higher close or a gap-up is suggested.

BULLISH MORNING DOJI STAR


BULLISH MORNING DOJI STAR

Definition :
This is also a three-candlestick formation signaling a major bottom reversal. It is composed of a long black candlestick followed by a doji, which characteristically gaps down to form a doji star. Then we have a third white candlestick whose closing is well into the first session’s black real body.This is a meaningful bottom pattern.

Recognition Criteria:
1. Market is characterized by downtrend.
2. We see a long red candlestick in the first day.
3. Then we see a Doji on the second day that gaps in the direction of the previous
downtrend.
4. The white candlestick on the third day confirms the reversal.

Important Factors:
The Doji may be more than one, two or even three. The reliability of this pattern is
very high, but still a confirmation in the form of a white candlestick with a higher close
or a gap-up is suggested.

BULLISH ABANDON BABY


BULLISH ABANDON BABY

Definition: The Abandoned Baby is a rare bullish reversal pattern characterized by a large down move followed by a doji or small candle, and then a third candle heading in the opposite direction.

Recognition Criteria:

   Day-one is a red day continuing an established bear trend.
   Day-two is a doji whose shadows trades below day-ones close.
   Day-three is a blue day that opens and trades above with little or no overlapping shadows

Important Factor: 

Candlestick Chart pattern scheme


CANDLESTICK CHAT PATTERN SCHEME
Bullish Reversal Patterns
Bearish Reversal Patterns

® Strong Bullish Reversal Patterns
® Strong Bearish Reversal Patterns
  1. Abandon Baby
  2. Morning Star
  3. Morning Doji star
  4. Three Inside up
  5. Three Outside up
  6. Three white Soldiers
  7. Rising three Methods

  1. Abandon Baby
  2. Dark Cloud Cover
  3. Evening Star
  4. Evening Doji Star
  5. Three Inside Down
  6. Three Outside Down
  7. Three Black crows
  8. Falling Three Methods

®Moderate Bullish Reversal Pattern
®Moderate Bearish Reversal Pattern
  1. Breakway
  2. Dragonfly Doji
  3. Bullish Engulfing
  4. Hammer
  5. Lader Bottom
  6. Peircing Line
  7. Three Stars in the South
  8. Tristar
  1. Advance Block
  2. Breakway Candlestick
  3. Dragonfly Doji
  4. Bearish Engulfing
  5. Tristars
  6. Gravestone Doji
  7. Hanging Man
®Weak Bullish Reversal Pattern
®Weak Bearish Reversal Pattern
  1. Belthold
  2. Gravestone Doji
  3. Inverted Hammer
  4. Tweezeers Bottom
  5. Three line strike
  1. Belt Hold
  2. Bearish Harami
  3. Shooting Star
  4. Harami Cross
  5. Tweezeers Top
  6. Three Line Strike


Click here to Sign Up

InstaForex